处理一个NodeJS程序内存泄露的问题
文章目录
这几天使用WebDriver写了个网页黑盒测试脚本,使用的是NodeJS SDK,但脚本运行时间比较长时,感觉node进程的内存占用越来越多,应该是内存泄露。这里把分析的过程记录一下。
原始代码
我的需求是打开一个网页,然后隔一段时间做一下鼠标移动操作,因此写了个简单的测试代码如下
testLeak1.js
'use strict';

const webdriver = require('selenium-webdriver'),
    By = webdriver.By;

const driver = new webdriver.Builder()
    .forBrowser('chrome')
    .build();

driver.get('https://www.baidu.com/');
const interval = 50;
driver.call(function* () {
  let el = yield driver.findElement(By.id('kw'));
  while(true){
    yield driver.actions().mouseMove(el).perform();
    yield driver.sleep(interval);
  }
});
然后运行它
node --max_semi_space_size=30 --max_old_space_size=60 --optimize_for_size ./test/testLeak1.js
为了让node进程不至于使用过多进程,我设置好几个v8的参数,v8的参数其实还是很容易查看说明的,可直接使用命令查看
$ node --v8-options | sed -n '/max_semi_space_size/N; /max_semi_space_size/p'
  --max_semi_space_size (max size of a semi-space (in MBytes), the new space consists of twosemi-spaces)
        type: int  default: 0
- –max_semi_space_size=30 设置半个new space的大小为30M(我这个压力测试会频繁申请释放内存,所以将new space设置大一点)
- –max_old_space-size=60 设置old space的大小为60M
- –optimize_for_size 在占用内存与程序执行速度间取得平衡
使用rrdtool查看heap堆大小的变化情况
最开始我使用node-inspector查看node进程的heap内存占用情况。操作如下:
npm install -g node-inspector
然后以调用方式启动node进程
node --debug --max_semi_space_size=30 --max_old_space_size=60 --optimize_for_size ./test/testLeak1.js
再打开node-inspector
./node_modules/.bin/node-inspector
再用浏览器打开http://127.0.0.1:8080/?port=5858,在chrome的开发者工具里可以对node进程Heap进行dump。
但发现使用node-inspector每次抓取heap快照时会引起GC。所以我使用rrdtool将使用的heap大小记录到rrd文件里。
在js代码的末尾加入代码
const rrdtool = require('rrdtool');

const db = rrdtool.create(__dirname + '/testLeak1.rrd', { start: rrdtool.now(), step: 1, force: true }, [
  'DS:heap_used:GAUGE:1:U:U',
  'RRA:AVERAGE:0.5:3:2400'
]);

function updateHeapUsed(){
    db.update({"heap_used" : process.memoryUsage().heapUsed});
}

setInterval(updateHeapUsed, 1000);
然后定时调用rrdtool生成图片
watch -n 5 rrdtool graph /Users/jeremy/dev/git/webdriverdemo/test/testLeak1.png --start now-10m --title "Used Heap Size" --width 800 --height 600 --font DEFAULT:14:monospace DEF:heap_used=/Users/jeremy/dev/git/webdriverdemo/test/testLeak1.rrd:heap_used:AVERAGE AREA:heap_used#ff0000
再用chrome浏览器打开此图片,当然可使用浏览器插件定时作一下刷新
heap使用情况如下图
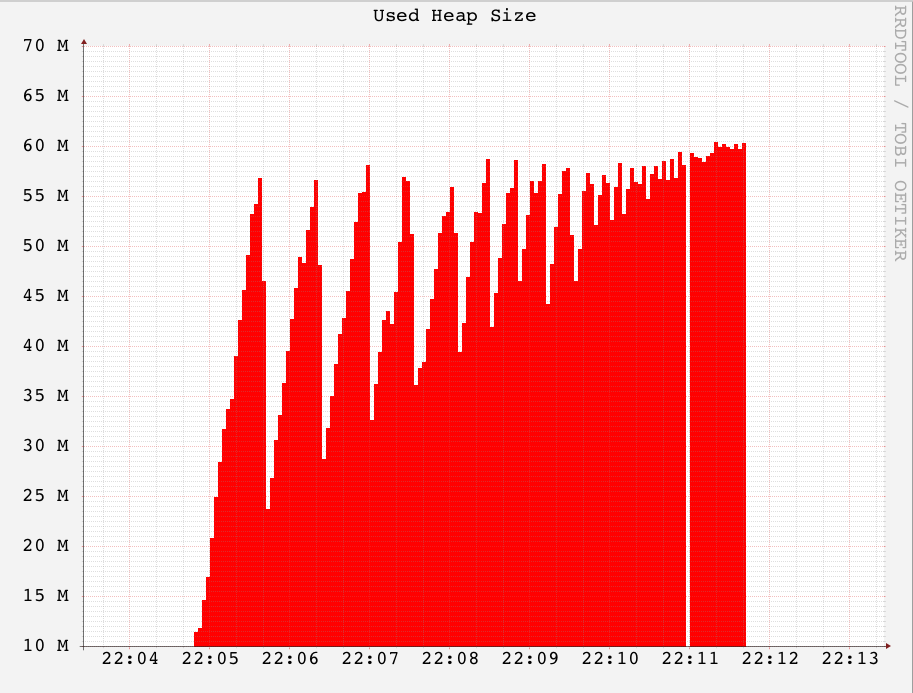
可以看到持续不断地有内存泄露,而且程序运行不到8分钟就OOM退出了。
再用node-inspector抓几个Heap快照对比一下,发现内存泄露都与ManagedPromise有关。
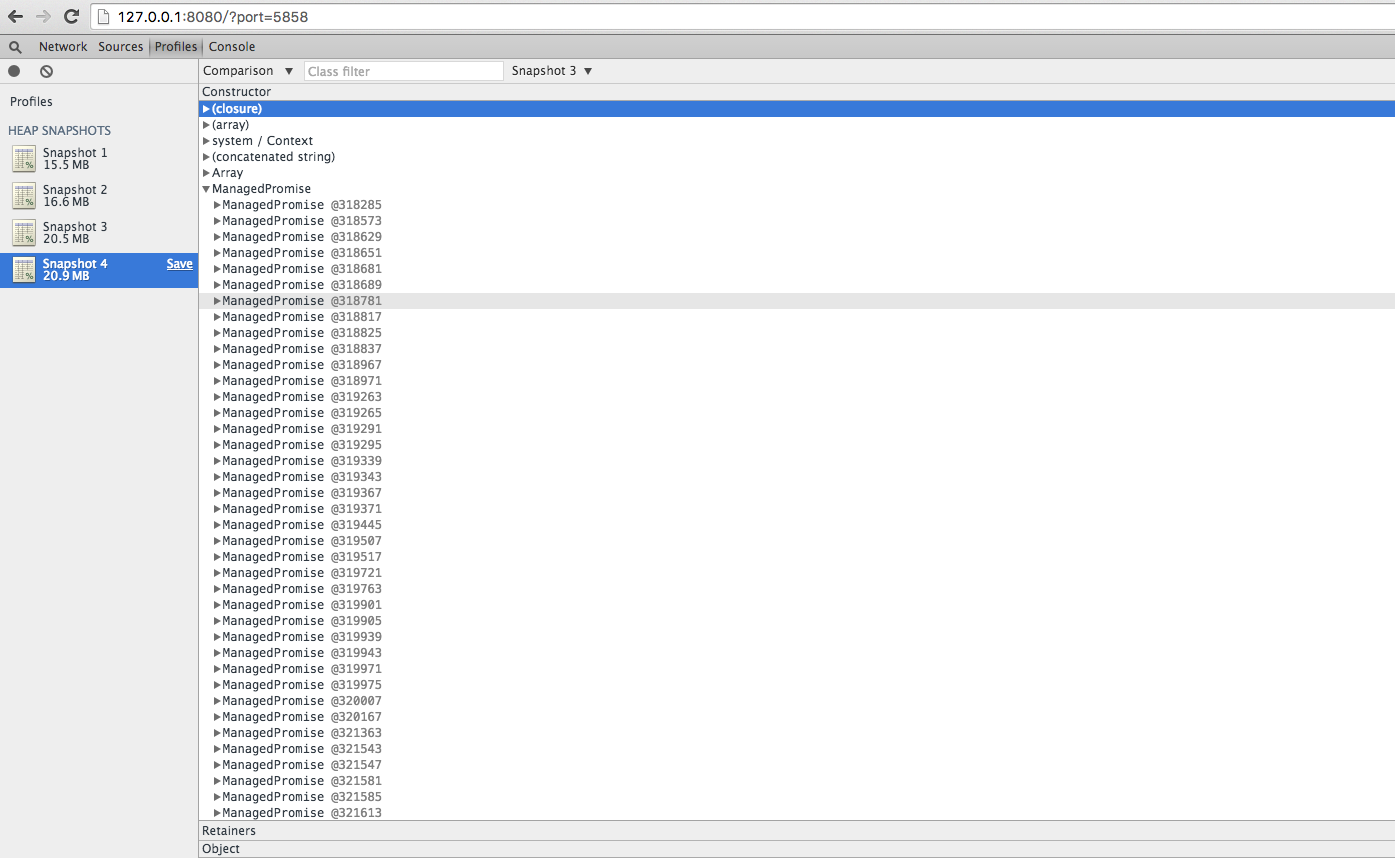
ManagedPromise是包含在selenium-webdriver库里的,源码在这里。
阅读了上述的promise.js的源码,WebDriver官方自己实现一个ManagedPromise的原因如下
The promise module is centered around the {@linkplain ControlFlow}, a class that coordinates the execution of asynchronous tasks. The ControlFlow allows users to focus on the imperative commands for their script without worrying about chaining together every single asynchronous action, which can be tedious and verbose. APIs may be layered on top of the control flow to read as if they were synchronous. For instance, the core {@linkplain ./webdriver.WebDriver WebDriver} API is built on top of the control flow, allowing users to write
driver.get('http://www.google.com/ncr');
driver.findElement({name: 'q'}).sendKeys('webdriver');
driver.findElement({name: 'btnGn'}).click();
instead of
driver.get('http://www.google.com/ncr')
.then(function() {
  return driver.findElement({name: 'q'});
})
.then(function(q) {
  return q.sendKeys('webdriver');
})
.then(function() {
  return driver.findElement({name: 'btnG'});
})
.then(function(btnG) {
  return btnG.click();
});
而且并没有发现与之相关的内存泄露报告
于是怀疑是WebDriver提供的Generator函数执行器有问题,改用co试试
用co驱动Generator函数
'use strict';

const webdriver = require('selenium-webdriver'),
    By = webdriver.By;
const co = require('co');

const driver = new webdriver.Builder()
    .forBrowser('chrome')
    .build();

const interval = 50;

co(function * (){
    yield driver.get('https://www.baidu.com/');
    let el = yield driver.findElement(By.id('kw'));
    while(true){
        yield driver.actions().mouseMove(el).perform();
        yield driver.sleep(interval);
    }
});

const rrdtool = require('rrdtool');

const db = rrdtool.create(__dirname + '/testLeak2.rrd', { start: rrdtool.now(), step: 1, force: true }, [
  'DS:heap_used:GAUGE:1:U:U',
  'RRA:AVERAGE:0.5:3:2400'
]);

function updateHeapUsed(){
    db.update({"heap_used" : process.memoryUsage().heapUsed});
}

setInterval(updateHeapUsed, 1000);
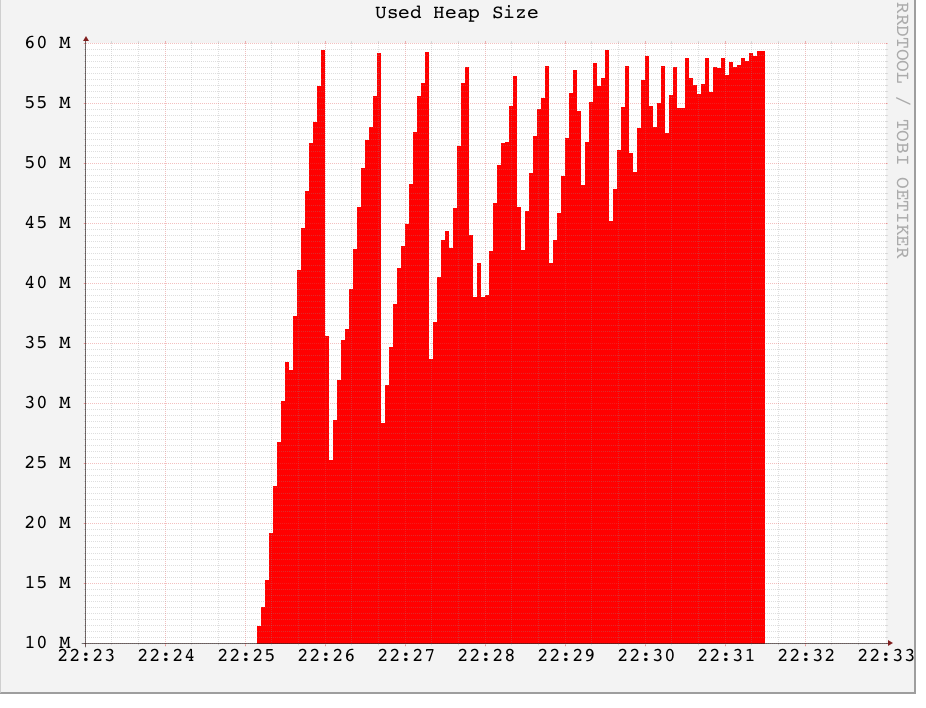
还是泄露地厉害,如下图
使用bluebird重写循环逻辑
在网上找了下原因,最终找到有人也提出了相同的问题。我分析了下,觉得原因是这样的。无论co还是driver.call,它们作为Generator函数的执行器,都是将Generator函数里的每个yield后面的promise连结成一串的,而这将导致这些promise对象无法被GC。在我的场景里本身就是一个死循环,不停有promise对象加入到这个串里,最终导致进程OOM退出。于是我尝试使用bluebird重写循环逻辑
'use strict';

const webdriver = require('selenium-webdriver'),
    By = webdriver.By;
const Promise = require('bluebird');
const promiseFor = Promise.method(function(condition, action) {
    if (!condition()) return;
    return action().then(promiseFor.bind(null, condition, action));
});

const driver = new webdriver.Builder()
    .forBrowser('chrome')
    .build();

driver.get('https://www.baidu.com/');
const el = driver.findElement(By.id('kw'));
const interval = 50;

function logErr(e){
    console.log(e);
}
promiseFor(function() {
    return true;
}, function() {
    return Promise.delay(interval).then(function(){
        return driver.actions().mouseMove(el).perform().catch(logErr);
    }).catch(logErr);
});

const rrdtool = require('rrdtool');

const db = rrdtool.create(__dirname + '/testLeak3.rrd', { start: rrdtool.now(), step: 1, force: true }, [
  'DS:heap_used:GAUGE:1:U:U',
  'RRA:AVERAGE:0.5:3:2400'
]);

function updateHeapUsed(){
    db.update({"heap_used" : process.memoryUsage().heapUsed});
}

setInterval(updateHeapUsed, 1000);
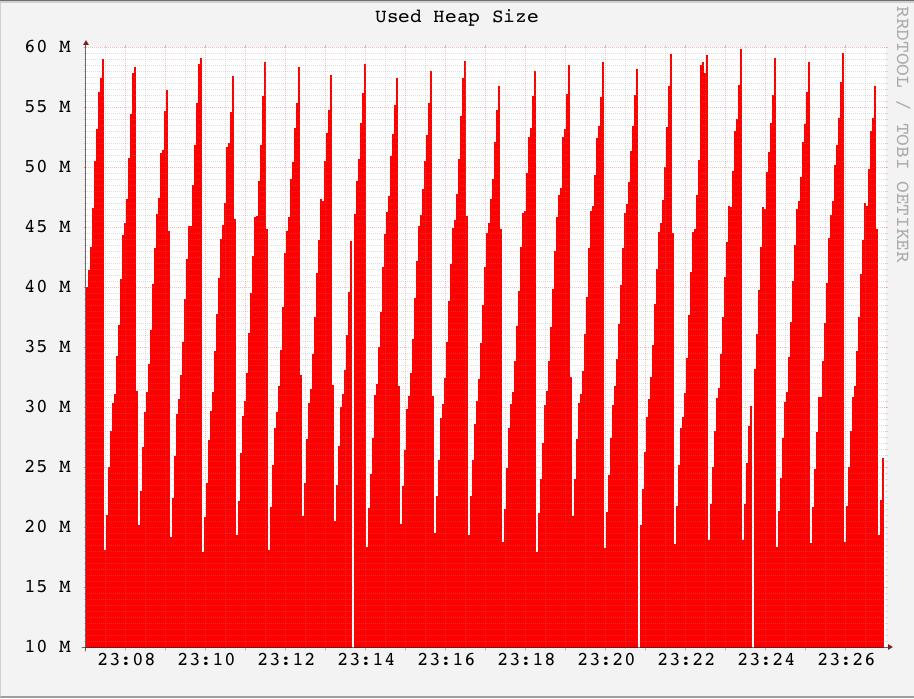
如上图所示,这次终于正常了。
总结
这次诊断NodeJS进程内存泄露问题很周折,但还是学到了不少东西,这里总结一下:
- 尽管ES6并没有规定一个Generator函数状态机里封装状态的个数,但实际操作时不要试图往Generator函数里塞进无尽的状态,目前来说Generator函数的执行器,比如co执行这样的Generator函数是会出问题的,最好采用
promiseFor这样的方案来实现相同的功能。 - 为了安全,Node进程运行时最好按需要指定
max_old_space_size参数,如果不指定,max_old_space_size的默认值很大,如果该进程申请内存又比较频繁的话,Node进程占用的内存会变得相当高。 - 分析NodeJS内存泄露的成因时,可利用node-inspector抓几个Heap快照对比一下,从对比的增量中一般可以看到究竟是什么产生了泄露
- 查看NodeJS进程的GC行为时,可以加
--log_gc、--trace_gc_verbose之类的参数,但在控制台上看到的数字不太直观,也可采用生成rrd文件的方式,改明我也写一下npm库,供大家更直观的查看NodeJS的GC状况。 - 尽管可以设置
--expose_gc参数,然后程序里调用global.gc();显式地进行GC操作,但最好不要这么干,正确的做法还是应该调整--max_semi_space_size、--max_old_space_size、--optimize_for_size参数,让NodeJS运行时寻找更合适的时机进行GC。 - 存储并查看时序相关的数据,使用rrdtool还是比较方便的。抽空要再看看rrdtool的文档
参考
https://blog.eood.cn/node-js_gc
https://developer.chrome.com/devtools/docs/javascript-memory-profiling
http://erikcorry.blogspot.ru/2012/11/memory-management-flags-in-v8.html
https://github.com/tj/co/issues/180
http://stackoverflow.com/questions/24660096/correct-way-to-write-loops-for-promise
文章作者 Jeremy Xu
上次更新 2016-05-29
许可协议 © Copyright 2020 Jeremy Xu